Where to find it
Open Insights from the left sidebar. It has four areas — Dashboard, Documents report, Users report, and API report — each with a Sender filter (all users or one person) and a Date range. Data refreshes hourly, and the last-updated time is always shown. This guide covers the first three.
1. The dashboard: your numbers at a glance
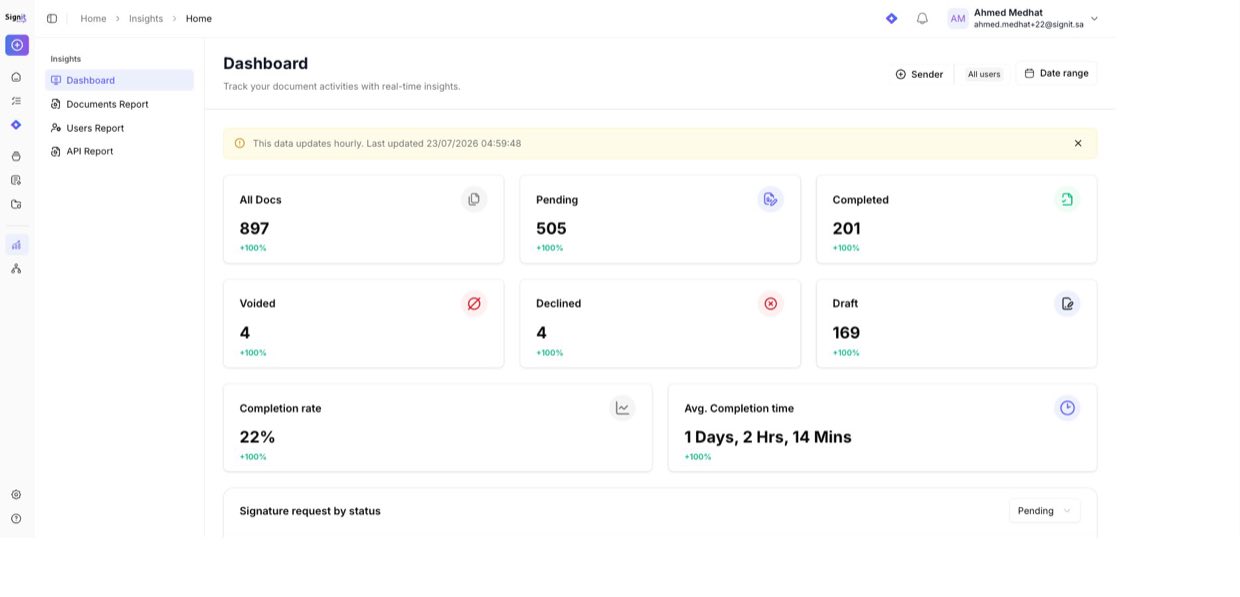
Insights → DashboardThe dashboard opens on a row of live counters — All docs, Pending, Completed, Voided, Declined, and Draft — each with the change versus the previous period. Below them, two headline metrics tell you how signing is really going:
- Completion rate — the share of sent documents that get completed.
- Avg. completion time — how long, on average, a document takes to finish (e.g. 1 day, 2 hrs).
Use the Sender and Date range filters at the top to focus on one person or period.
2. Trends over time
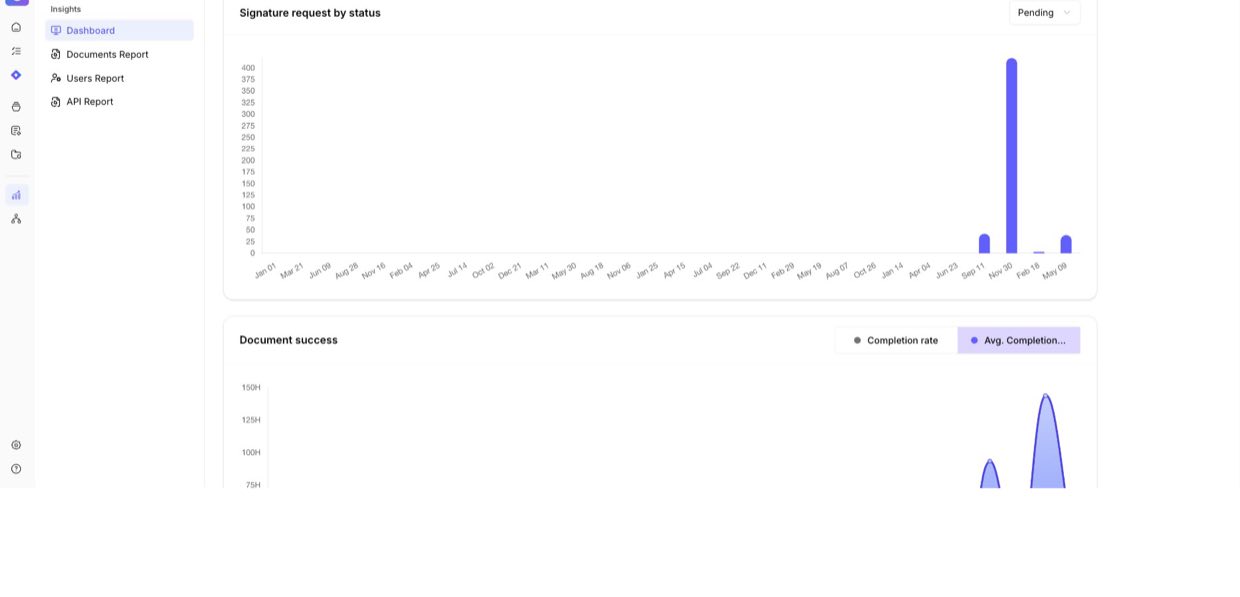
ChartsUnder the counters, two charts show movement rather than a single number. Signature requests by status plots volume over time and can be filtered to a status (Pending, Completed, and so on). Document success tracks your completion rate and average completion time across the period, so you can spot whether things are speeding up or slowing down.
3. Documents report
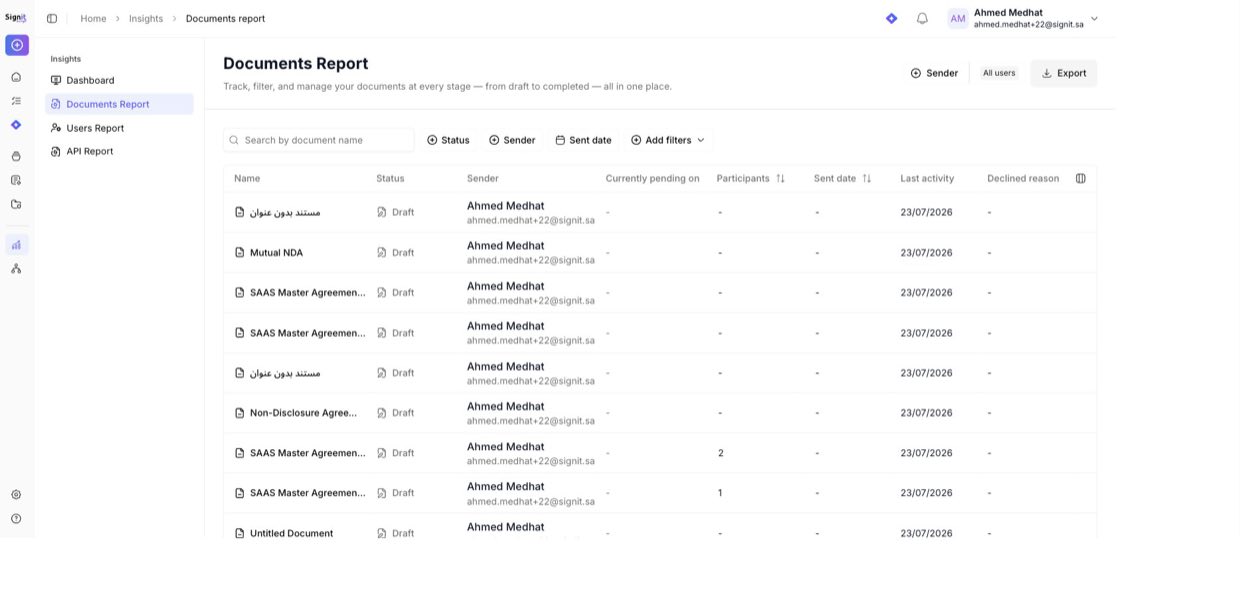
Insights → Documents reportA searchable, filterable table of every document — name, status, sender, who it's currently pending on, participants, sent date, last activity, and any declined reason. Filter by status, sender, or sent date, choose which columns to show, and click Export to download the results as a CSV for your own analysis or records.
4. Users report
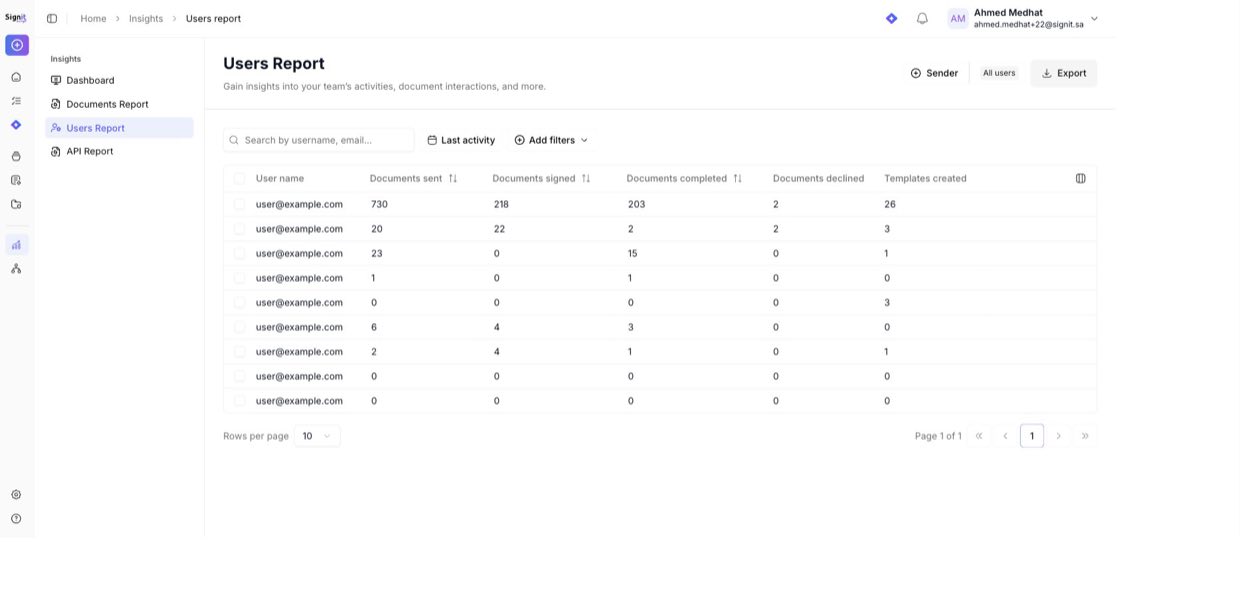
Insights → Users reportSee how each member of your team is doing: documents sent, signed, completed, declined, and templates created. Search by name or email, sort any column, and Export the report. It's the quickest way to understand adoption and workload across the organization.
Good to know
Insights data updates hourly — the dashboard always shows the last-updated timestamp.
The Sender and Date range filters apply across the dashboard; reports have their own filters.
Both reports export to CSV, so you can build your own charts or share numbers outside Signit.
What you see depends on your permissions — admins can view activity across all users.
Need help?
Questions about a metric or an export? The Signit support team can help.
Signit support team
Reach out for help — or contact your dedicated account manager for urgent issues.
Was this article helpful?